Source Code Plots
These plots show the lifetime of lines of code in the pipeline. They were
generated using git-of-theseus and are here primarily for amusement. You
can regenerate these plots in the source code directory by running make
theseus and committing the updated plots.
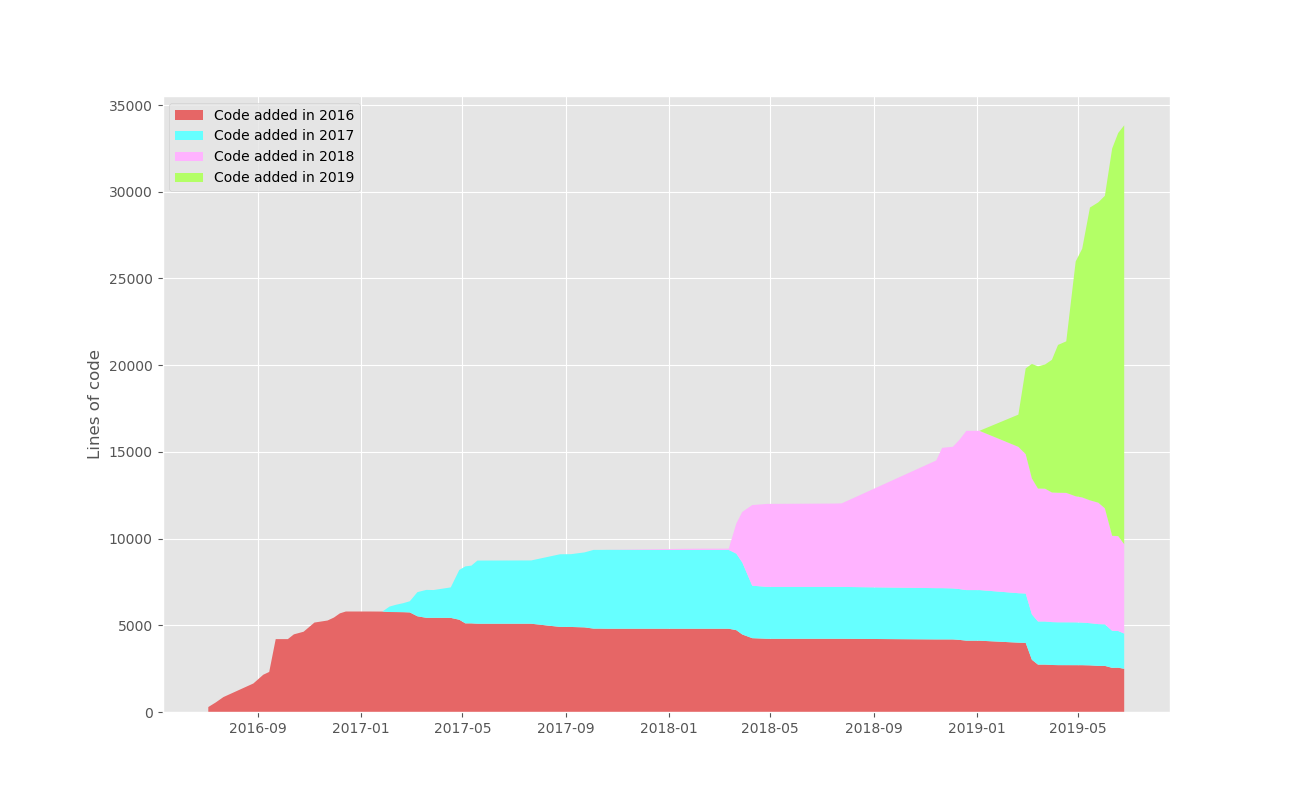
History of python code in the repository over time, showing rates at
which code has been added and replaced.
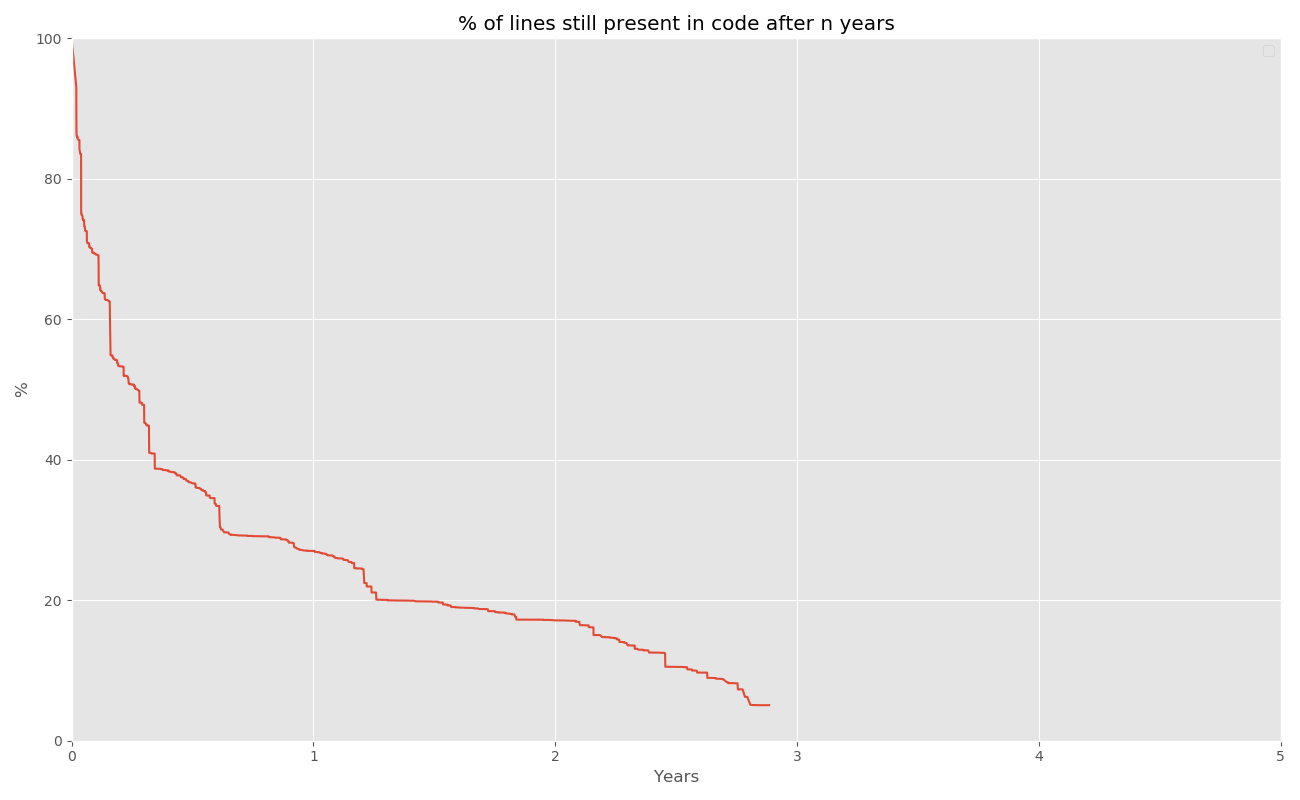
Average lifetimes of lines of code in the repository.